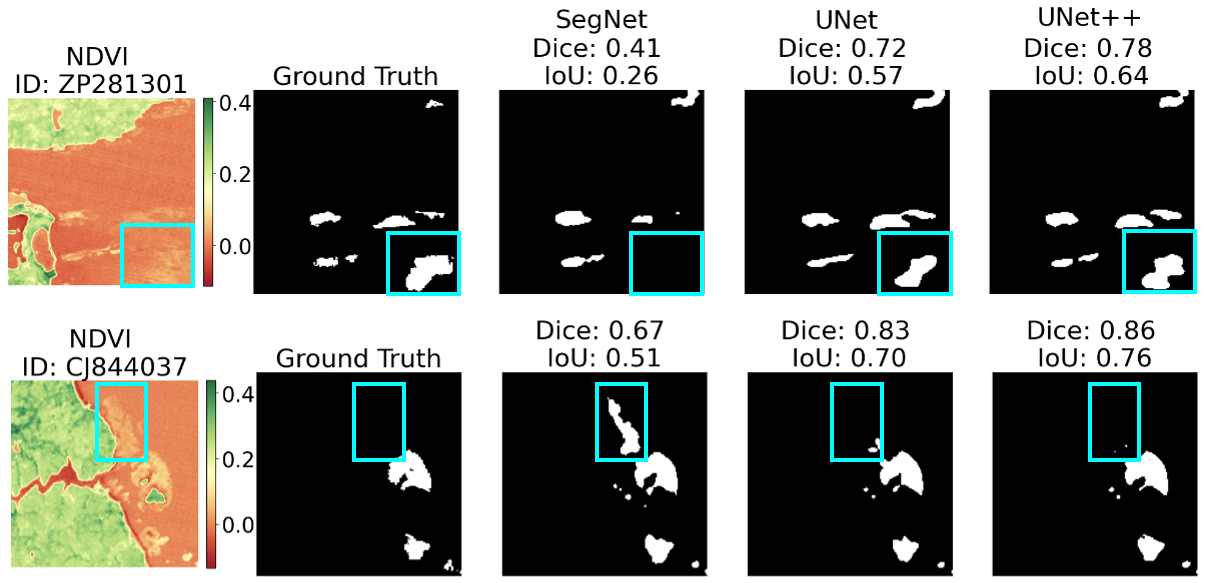
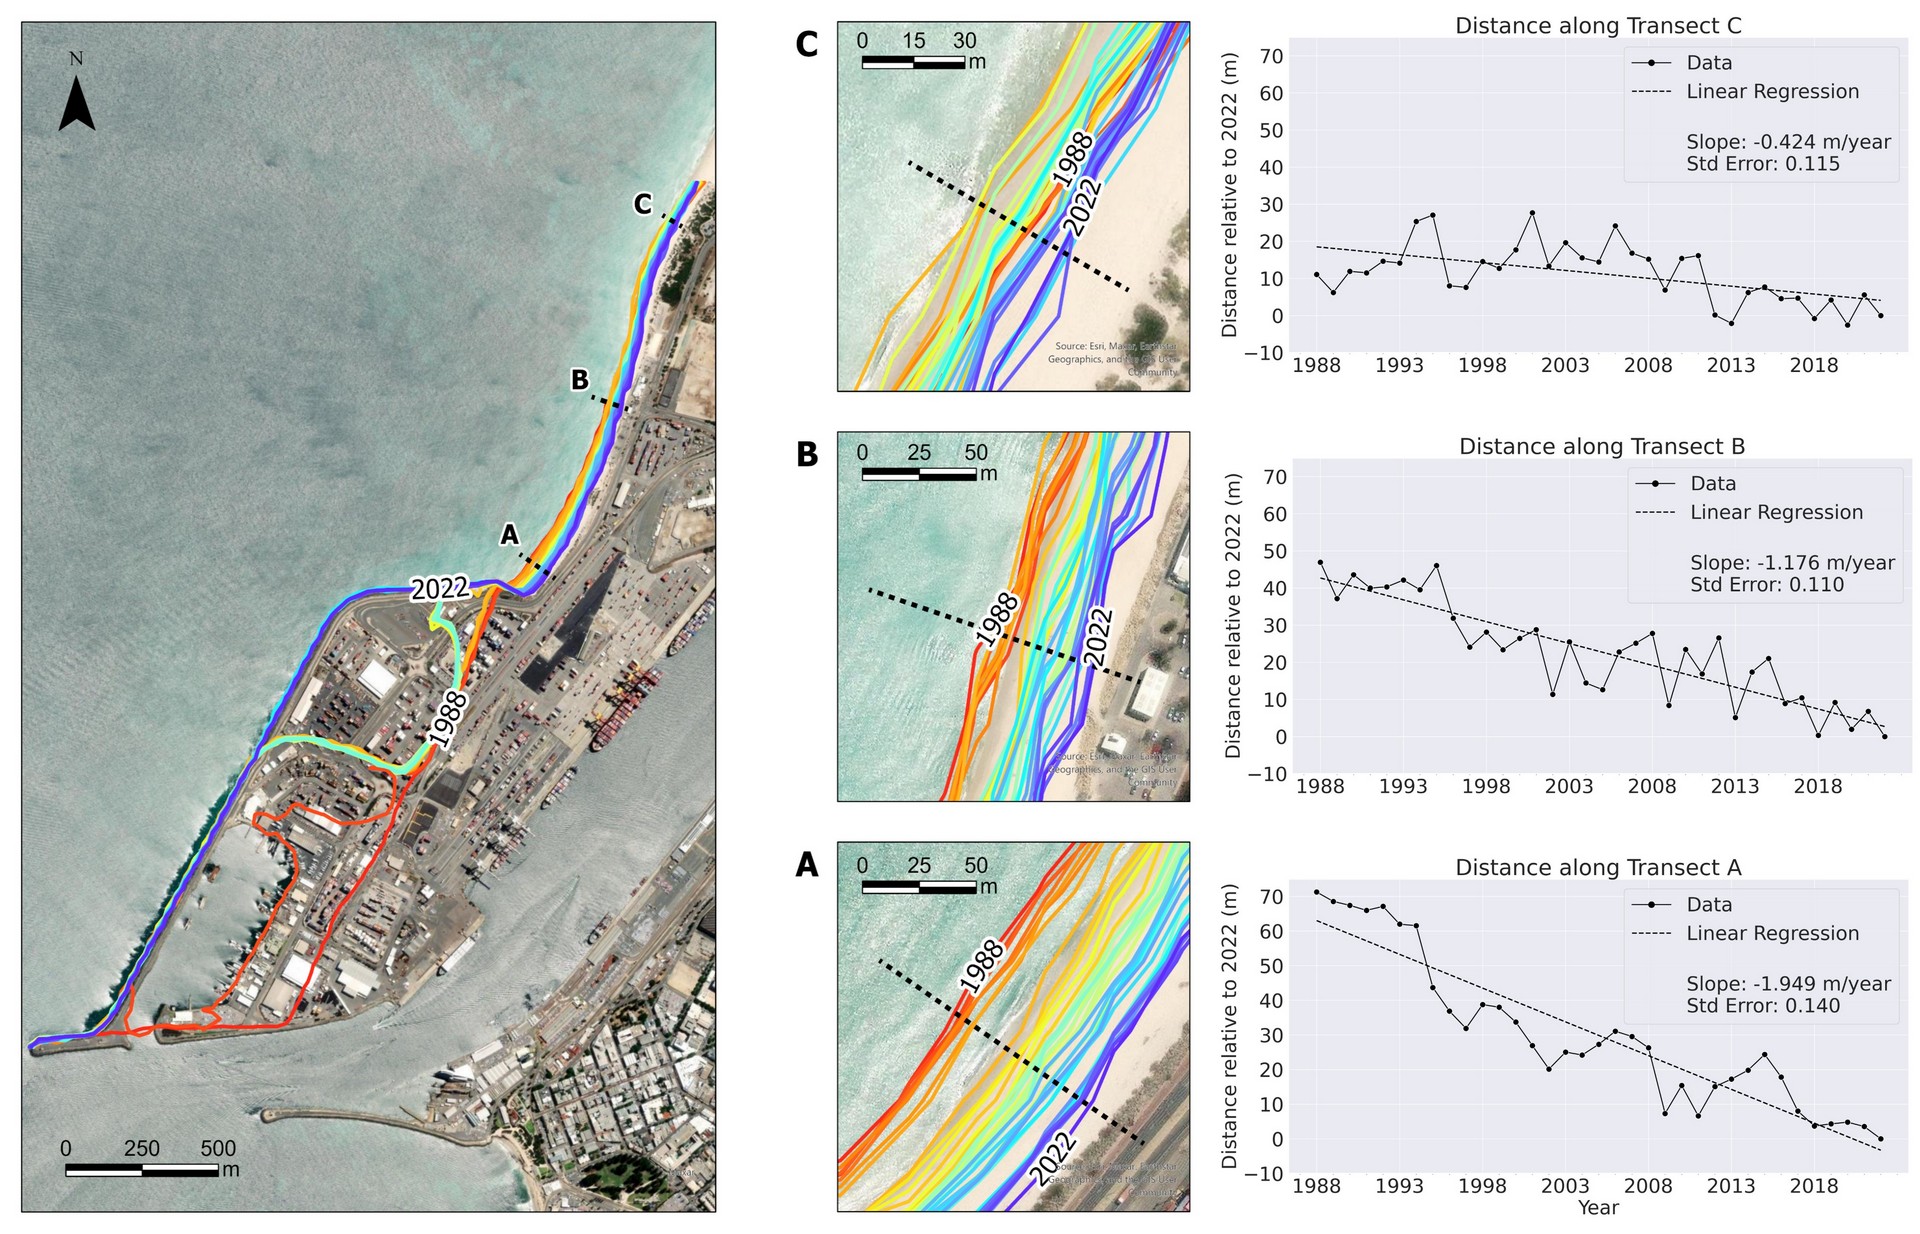
MARÍA RODRÍGUEZ

THIRD SEMESTER (Université Bretagne Sud)

Multimedia Content

Visualization of car accidents in Chicago (USA)

Course: Interactive Data Visualization
January 19, 2024

Using data visualizations with Vega-Lite and Kepler, in this blog it is explored the frequency ​of car accidents across Chicago's boroughs and their primary causes between January 3, 2021, and May 5, 2021.

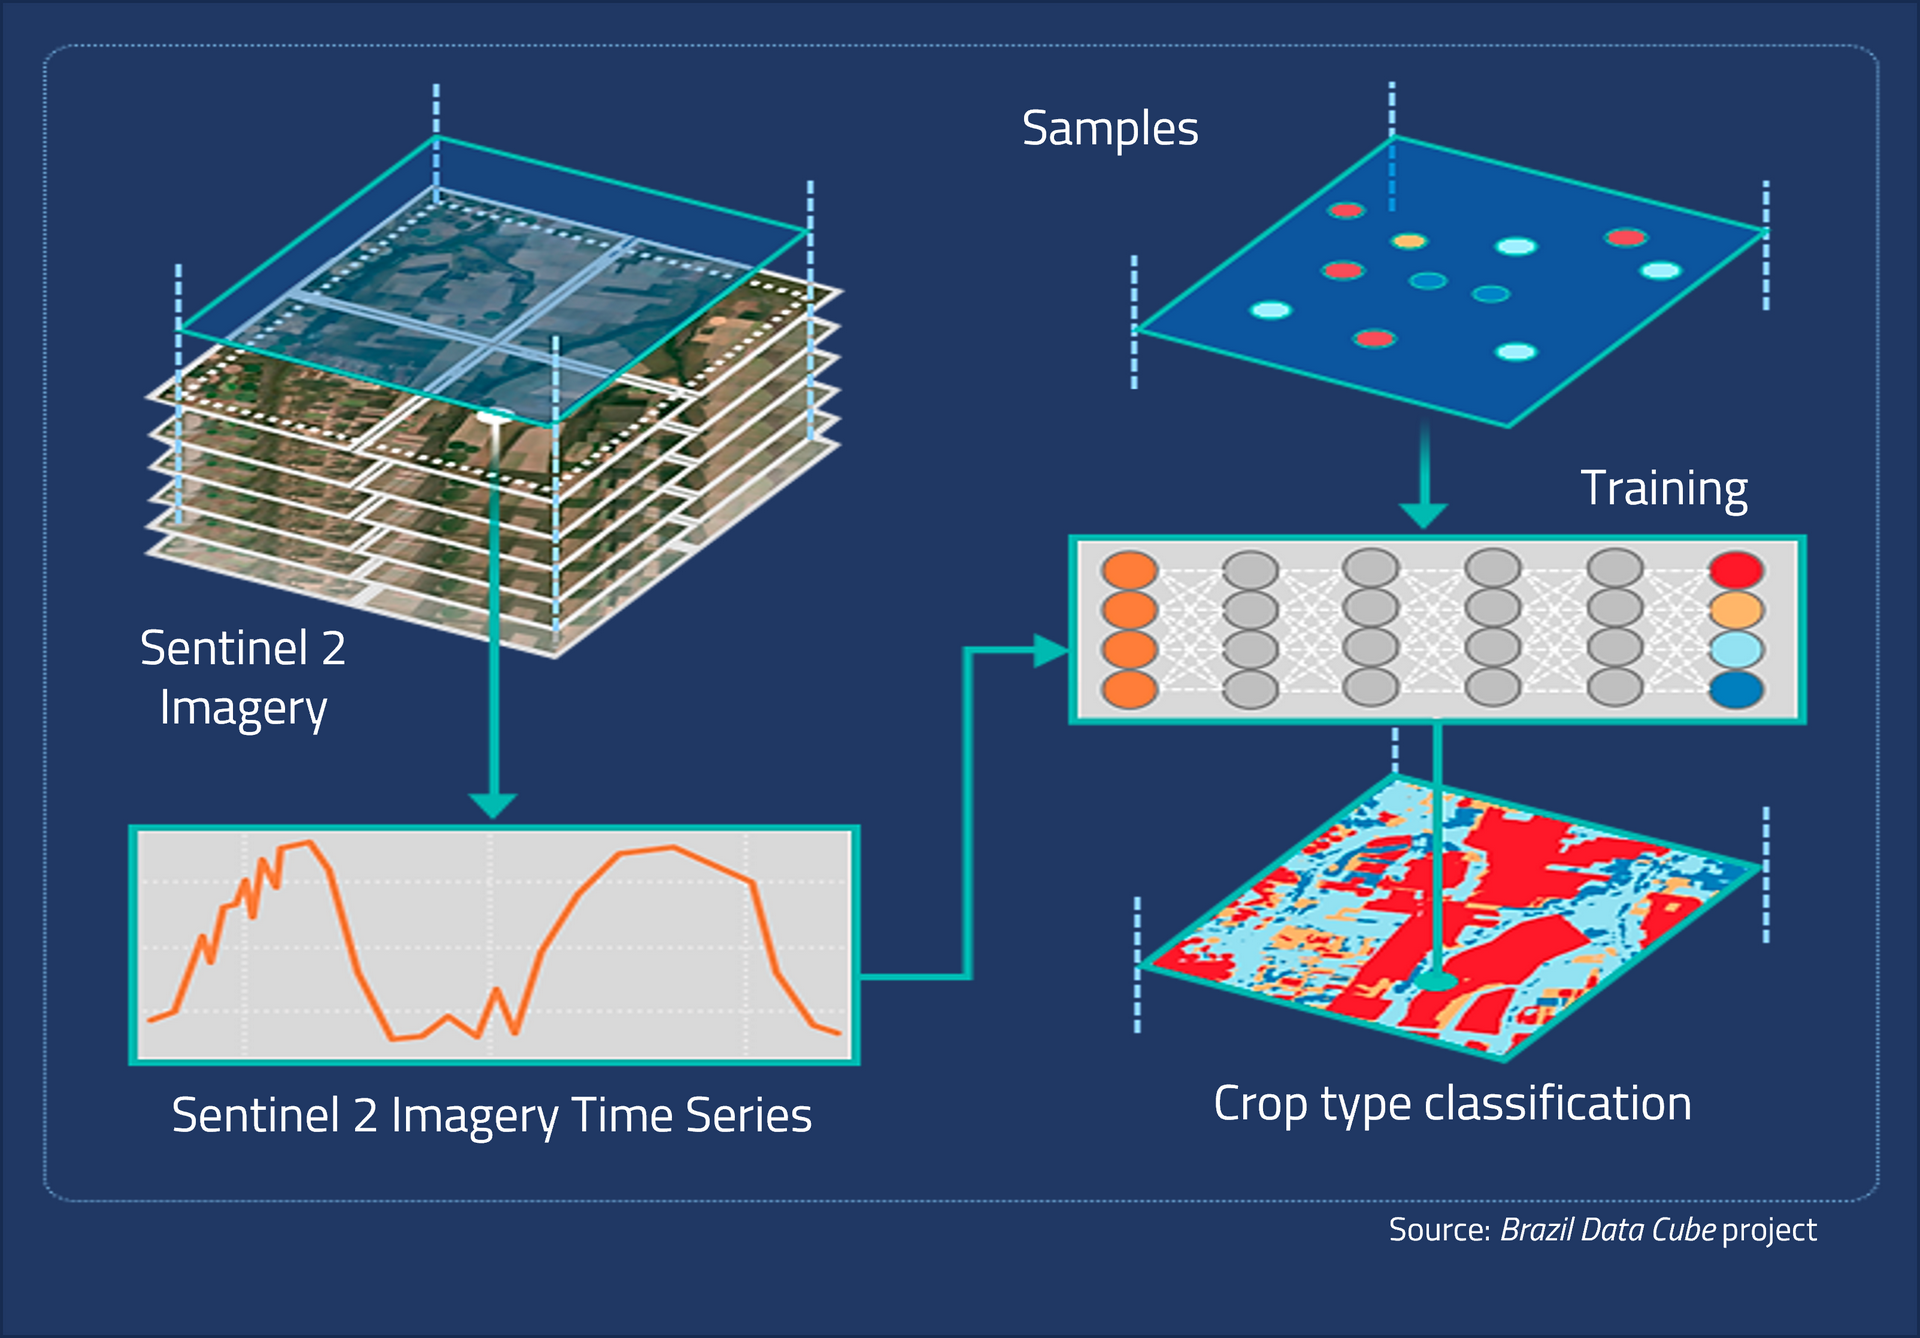
Deep Learning models for crop-type classification

Course: Deep Learning
January 5, 2024

The main idea of this notebook is to classify various crops by analyzing time series data collected from France via Sentinel 2 satellite imagery. Specifically, three approaches are studied and compared: MLP, LSTM and Self-Attention Transformer Network.

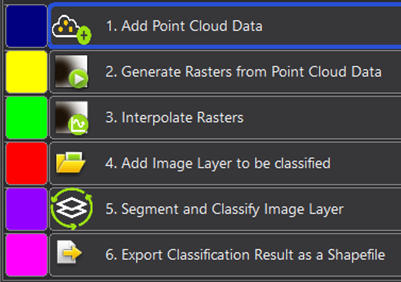
Internship Spatial Services GmbH


Course: Summer Internship
March 17, 2013 - July 31, 2013

Internship Report - The main acomplished tasks were: dwelling extraction using deep learning techniques, production of density maps in ArcGIS Pro, Flood Detection with GEE and development of Arcpy tools for data management.

Files and Documents

Kelp Wanted: Semantic Segmentation of Kelp Forests

Course: Practical Workshop
January 23, 2024 - February 22, 2024

In this paper, it is detailed the methodology and results obatained with my team after participating in the challenge hosted by Driven data to segment Kelp Canopy  using Landsat satellite imagery and labels generated by citizen scientists.

Coastline change in Port Beach (Western Australia) from 1988 to 2022

Course: Analysis and Modelling
July 29, 2023

This paper focuses on analyzing the Landsat 5, 7, 8, and 9 Analysis Ready Data (ARD) products available within the Digital Earth Australia (DEA) datacube to identify patterns and rates of coastal erosion or accretion at Port Beach.

W​orking with LiDAR - eCognition App 


Course: ​Application Development (OBIA)
August 15, 2023

The main objective of the App is to classify an Image Layer's Low Vegetation, Trees, and Buildings. This is achieved by leveraging not only the spectral and contextual features of the Image Layer but also by integrating information about Height and Number of Returns from a LiDAR point cloud.